Project reviews, or retrospectives, are broadly adopted within agile and other development communities as a mechanism to enable team learning through experience. They are often structured as a forum for the team to review recent experiences in a constructive way, then moving onto generating a list of lessons learned and potential changes to investigate or include in future development work. The reviews are frequently supported by only minimal data which can lead the team to be ignorant of significant but gradual changes over the course of the project, or as a mechanism to support hypotheses of the team. Could a ready access to such metrics and reports for use in a supporting role within retrospectives be effective?
End of Project and Iteration Retrospectives
Most teams start with retrospectives occurring at the end of the project, as described in Norman Kerth’s Project Retrospectives: a handbook for team reviews. This provides a great vantage point to take in the full extent of the entire project, and can produce a worthwhile holistic view of the proceedings, team reconciliation, generate issues to be wary of the next time, and observations and discovered techniques for passing on to future projects.
Still, one can feel that some of the value from the process is lost by holding the meeting at the end of the project when so much has been forgotten and where one is not able to immediately apply the suggestions. Agile processes typically suggest holding retrospectives more frequently, often to mark the end of each iteration, which could be every couple weeks or month. Suggestions can be acted upon and even refined over time by exposure to multiple retrospective sessions. The shorter period under examination can also make the meetings more tractable.
Often these meetings are supported by minimal supporting materials that document the development process, such as only a time-line of significant events, more to log the memory of the attendees than to act as a tool to help with analysis. As such the team is often blind to trends over the course of the project that might reveal items of significant impact on the project, or to clarify the extent of issues that frustrated the team but which they don’t fully understand through casual observation.
We would suggest that ready access to some simple trending of metrics over the course of the project could help to trigger discussions on unexpected traces or to act as a basic tool to assist in resolving pressures felt by the team.
As an example, here are a pair of charts from a project:
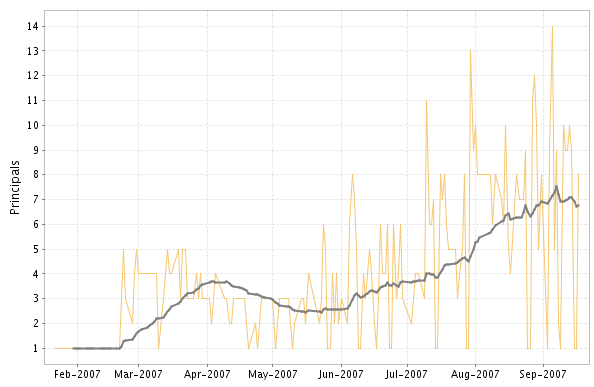
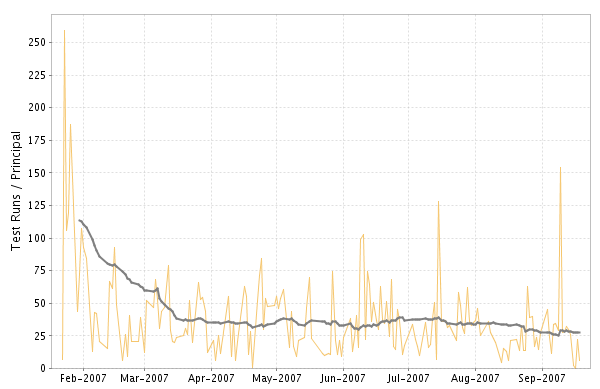
The principals chart shows the growth in the number of developers over the course of the project. This is paired with the number of test runs executed by each developer.
You can see the dramatic reduction in testing activity from the early highs as the team move away from a small code base and the team expands. Then a constant stretch before the rate starts to decline at the end, possibly related to the influx of new developers to the team.
These charts are not rigorous, but they suggest a significant conversation from the team and the impact of the aging code-base, team growth and change of testing practices over the course of project.
Task and Development Session Retrospectives
There is another scale at which retrospectives or reviews can provide benefit. At the end of a piece of work, a development session, or the end of day. This allows the developer or the pair to review the major events in the session. Holding such a review immediately afterwards means the session is still reasonable fresh in the mind and significant but transient associated events such as failed paths, distractions, observations can still be acted upon. The really nice thing is that you can gain the benefits the following day rather than weeks or months in the future.
This review can be driven by simple recollections of the session, supported by design diagrams or to-do lists which were already created as part of development. These can be poor at recording all the twists and turns and the timing of events though.
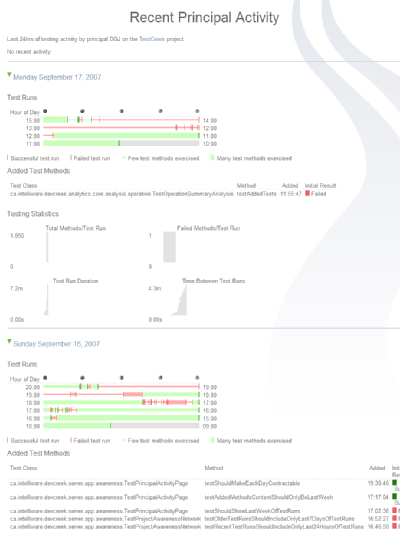
The recent principal activity webpage shows a summary of the timing and result of all the test runs during the session, any added test methods, and some simple metrics shown as histograms.
This can be used for simple comparison with the session normals, highlighting if few new tests were written for example. It can also give a recap of the session, highlighting how much time was spent on bad paths or time spent debugging. Exploration of alternatives is often a very positive techniques but there are skills to be learnt to know when to close down one path and try another, such timing could help to refine techniques related to defining that choice point. Recognizing time spent triggered by poor technique can be used to understand the costs and so feedback into decisions on how much effort should be expended to reduce the chance of a similar problem in the past.
Originally posted on community.devcreek.com