
|
|
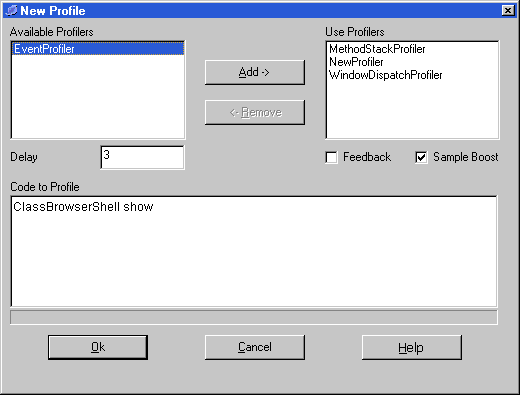
| New Profile Dialog |
|
The New Profile dialog lets you specify the code whose evaluation is going to be profiled, and which aspects of its behaviour are to be recorded.
The dialog can be opened from a number of the Profiler windows, and also by evaluating the following from the Transcript:
Svengali current newProfile
| Structure |
The pair of List views allows you to select which of the profilers are to be used to collect data on the profiled code. You may choose any number, but choosing more than one can cause interferences in the timing recordings.
The following row of controls provides some fine tuning over the profiling. Delay is the number of milliseconds between each sampling. In practice you will often find a minimum of six - to ten milliseconds under Windows. Enabling Feedback will write the number of samplings to the top left of the screen during profiling. It is better to run with this left off. The Sample Boost is a cheat to slow down the VM so that less activity rushes by between samples. There is no reason engaging this if no sampling profilers are being used, or your machine is already slow enough...
The code to be evaluated should be typed into the middle text area. It is evaluated on pressing OK. Any compilation problems will be reported back to the status bar below, in the same way as the Dolphin browsers.
Once you are happy with the details click OK to commence the profiling. During the process you will find that Dolphin is unresponsive, and will effectively lock-up until the process has completed.
NT4.0 users may find it reassuring to have a minimised task manager to reassure you that something is actually happening :-)
On completion a Profile Director will be opened, from where you can browse the results of the profile.

