
|
|
| Profile Browser |
|
The Profile Browser provides a view onto all the raw data collected during profiling. It can be useful to reveal interactions between strands, marvel at the shear amount of computation that goes, and use the compression feature to see the different stages of the profiled code.
The Profile Browser can be opened from the Profile menu of the Director. Any number can be opened and they are usually reactive.
| Structure |
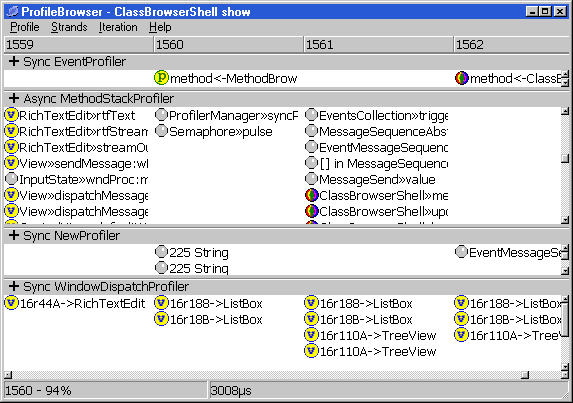
The view is split into equally spaced columns. Each column contains all the data collected during profiling within a single iteration of sampling. The column header reports the iteration number and the status bar informs you of the iterations percentage position of all collected iterations and microsecond duration of the sample, for the iteration under the mouse.
Each column is split by the profilers which collected the data. The grey title bars running horizontally indicate which one of the profilers the results were collected from. Each result is displayed as a line combing a profiler specific description and identifying icon. Results are ordered from the first to be collected by the profiler during that iteration.
| Functions |
The view supports a number of features to help you navigate the mass of data. The current selection is shown, and can be changed with the cursor keys, by directly selecting another entry and by the Iteration/Go to command.
A profilers results can be collapsed to a single line, or expanded back, by toggling the title bar.
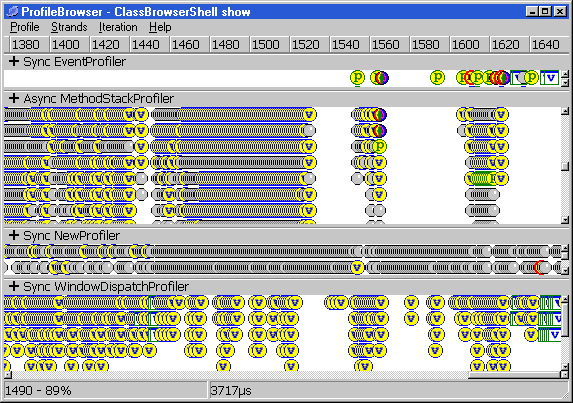
The width of a single iteration can also be changed with the Iteration/Column Width command. At very small values, less than the width of the entries distinguishing icon, great swath of iterations become viewable at one time, the compression feature.
| Opening Browsers |
Most profilers have a number of specialist browsers which can provide a more coherent view of their collected data than the simple iteration display of the Profile Browser. These may be chosen from the Strand menu, and each profiler row has its own context menu of relevant browsers.
| Definitions of Strand Results |
A result describes a single entry collected by the profiler. The format of the results is described below
| Strand | Icon | Text |
|---|---|---|
| Event | Class of object which triggered or receiver event. | Name of the event, followed by either <- if the event is being sent, or -> if it is being received, by the following object. |
| Method Stack | Method on stack | [] if within a block, followed by the method name on the stack. |
| New | Class of the created object | Indexed size if the created object's class is variable, followed by the class of the object. |
| Window Dispatch | Class of view receiving the message | Number, or name if entry recorded in View's MessageMap, of the message, followed by the class of the receiving view. |


