|
|
| Execution Mural |
|
The Execution Mural view displays the results collected during tracing.
This is a limited implementation of the application described in the following paper:
Visualizing Message Patterns in Object-Oriented Program
Executions
Dan F. Jerding, John T. Stasko, and Thomas Ball
Graphics, Visualization, and Usability Centre
Georgia Institute of Technology
Atlanta, GA 30332-0280
Technical Report GIT-GVU-96-15
http://www.cc.gatech.edu/gvu/softviz/

| Structure |
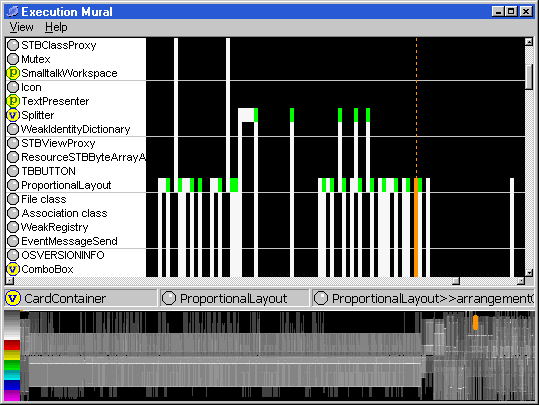
The top view shows the individual activations of a traced evaluation. Time is present on the x-axis, with each unit corresponding to a recorded activation. Along the y-axis all of the classes of the receivers of an activation are listed, ordered such that a subclass will always be further down the view than its superclass. For each activation a vertical line is drawn from the class of the sender, to the class of the receiver of the activation. The sender is marked by a green point. The connecting line is coloured depending on the plane which the activation has been associated with. The associated is defined by the Highlights dialog, available from the View/Highlights menu item, and is based on the selector of the activated method. By default a method is associated with the empty plane and shown in white.
The currently selected activation is shown with a dotted orange column. The selection may be changed with the cursor keys, with return opening a browser onto the method of the activation.
The status view situated in the middle of the shell shows details of the selected activation. The first two items are the class of the sender followed by the class of the receiving object. The third item is the method of the activation.
The lower view presents all of the activations in a similar form to the top view but compressed to fit within the visible extent of the pane. It can be used for navigation, by selecting the area shown in the top pane. It is also useful for highlighting the repeating patterns of activations as well as the separate computation sub-stages of the whole trace.
| Functions |
One useful feature is the Execution Statistics view available from the View/Statistics menu item. This lists the total number of method activations grouped by class, method and selector. It can be useful for specifying plane highlights.