|
|
| Message Tally Browser |
|
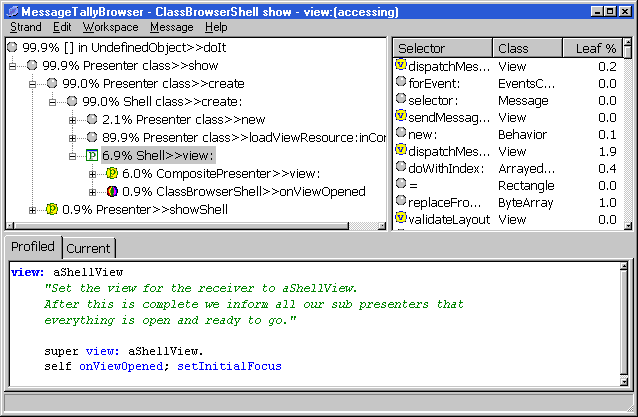
The Message Tally Browser displays a tree of method calls generated from the sampled method stacks collected by the Method Stack Profiler.

The Message Tally Browser can be opened from the Strand menu of the Director. Any number can be opened and they are not reactive.
| Structure |
The top left view contains a Tree view onto the generated message calls. This is generated by merging together the sampled method stacks collected by the profiler. As this is based on data generated by sampling it probably will not show the full coverage of method activations that occurred. The nodes indicate the percentage of time of the complete measured period spent within that method, or a method which it in turn calls.
The top right view displays a list of the active methods from the calling tree. These are the culmulative totals for methods which were active when sampling took place.
Selecting a method from either the full tree or active will display the source in the lower view. You may choose to see either the method at the point of profiling, or the current version associated with that Class and selector. It is possible to compile a method definition here.
| Functions |
The calling tree can be filtered to show only messages which consume greater than a minimum percentage of the complete time, or which are owned by particular packages. This can be set from the Filter Messages dialog available from the Message/Filter Messages menu entry.
| Comments |
Gauging the full extent of recursive methods can be difficult by drilling down with the tree. For raw percentage calculations you can use the Message Statistics browser to 'cut though' the various layers, collating together all the separate levels into one.